Most organizations should plan for IT spending between 4% and 6% of revenue, with the median enterprise sitting close to 5.49% according to widely cited industry aggregates. That baseline shifts hard by industry and company size, and 2026 adds a new wrinkle: an "AI premium" on top of traditional line items that most legacy benchmarks never accounted for.
TL;DR:
- Smaller companies often spend a higher percentage of revenue on IT than larger firms, with small businesses paying 6% to 10%, because fixed costs do not scale down.
- Industry benchmarks vary widely, from 15% to 25% for software and tech firms to around 4% for retail, so selecting the correct percentile is crucial based on company strategy and risk tolerance.
- The AI premium adds extra costs for licensing, compute, and governance, which can be funded by rationalizing existing SaaS spend or phasing AI projects to avoid budget spikes.
- Categorizing IT spend into software, cloud, cybersecurity, and outsourcing helps identify focused cost drivers, with software and SaaS now making up nearly half of most IT budgets.
- Using a fixed, predictable monthly cost model, including bundled security and support, improves budget stability and aligns spending with operational goals.
Table of Contents
- How Much Should Your Industry Spend on IT?
- Does Company Size Change the IT Budget Percentage?
- How Do You Calculate IT Budget as a Percentage of Revenue?
- How Do You Set the Right IT Percentage for Your Organization?
- Where Does the Money Actually Go Inside an IT Budget?
- Should IT Spending Be Treated as OpEx or CapEx?
- What Is the AI Premium and How Do You Budget for It?
- What Metrics Should You Bring to the Board?
- What Do Clients Usually Do Once They Know Their Number?
- Turn Your IT Percentage Into a Predictable Monthly Number
- Sources
- FAQ
How Much Should Your Industry Spend on IT?
The 4% to 6% baseline is a starting point, not a target. Once you break it out by sector, the range gets wide enough to make a single average nearly useless for planning. Deloitte's technology spending research sets the enterprise baseline at 4% to 6%, but software and technology companies routinely spend four to five times that because their product is the technology.
| Industry | Typical range | Reported median |
|---|---|---|
| Software / tech products | 15% to 25% | 15% to 25% |
| Technology hosting / cloud services | 10% to 18% | 10% to 18% |
| Financial services | 7% to 11% | ~10% |
| Healthcare | 3% to 6% | ~5% |
| Manufacturing / industrial products | 2% to 5% | 2% to 5% |
| Retail | 2% to 4% | ~3% |
| Public sector | 3% to 5% | ~4% |
These figures come from ITBudgetCalculator's compiled industry data, which draws on Deloitte and Flexera reporting. A manufacturer treating 15% as a floor is probably paying for capability it doesn't need.
This is where percentiles matter more than averages. APQC's benchmarking methodology recommends looking at the 25th, median, and 75th percentile for your peer group rather than a single average, because IT spending distributions skew heavily. A handful of digital-native companies pull the mean upward, which makes the median a more honest read on what a "typical" competitor spends.
Three questions before you pick a percentile target:
- Where does your regulatory exposure sit relative to peers (healthcare and financial services trend toward the 75th percentile because of compliance overhead)?
- Are you trying to match the market or lead it? Median is defensive; 75th percentile signals investment ambition.
- How mature is your cloud migration? Companies mid-migration often show temporary spikes that don't reflect steady-state spend.
Does Company Size Change the IT Budget Percentage?
Yes, and often in a counterintuitive direction. Smaller companies frequently spend a higher percentage of revenue on IT than large enterprises, not because they're overspending but because fixed costs (a help desk, core software licenses, basic security tooling) don't scale down proportionally with revenue.
- Small businesses ($1 million to $10 million revenue): Often 6% to 10% of revenue. A $5 million company spending 7% puts $350,000 a year into IT, much of it locked into fixed platform and staffing costs regardless of headcount.
- Mid-market ($10 million to $250 million revenue): Typically 4% to 7%. Economies of scale start kicking in as fixed costs get spread across a larger revenue base.
- Enterprise ($250 million-plus revenue): Usually 2% to 5%, though this compresses further at the largest scale because negotiating leverage and shared infrastructure lower the per-dollar cost of IT.
There's an exception worth flagging: digital vanguards, meaning companies that treat technology as a growth engine rather than a cost center, consistently allocate more than their size-band median and outperform peers on business outcomes. A mid-market manufacturer investing in automation and data infrastructure at 8% instead of 5% isn't necessarily overspending. It may be buying a competitive advantage its peers haven't priced in yet.
How Do You Calculate IT Budget as a Percentage of Revenue?
The standard formula, per Avasant's benchmarking framework, is straightforward:
IT Budget % = (Total IT Spending ÷ Total Revenue) × 100
The complication is what counts as "total IT spending." Get this wrong and your benchmark comparison is meaningless. Include these categories in the numerator:
- Hardware (servers, workstations, networking equipment)
- Software licenses and SaaS subscriptions
- IT personnel salaries and benefits, including contractors
- Cloud infrastructure and hosting costs
- Cybersecurity tools, monitoring, and services
- Outsourced IT services and managed service contracts
- Depreciation and amortization on IT capital assets
For external benchmarking against industry reports, use the accounting-basis figure that includes depreciation, since that's how most published benchmarks (including APQC's) calculate it. For internal planning and cash-flow decisions, a cash-basis version that counts actual capital outlay in the year spent, rather than spreading it over its useful life, often gives finance teams a clearer picture of near-term budget pressure.
How Do You Set the Right IT Percentage for Your Organization?
Benchmarks tell you where peers land. They don't tell you where you should land. Use this four-step method to translate a benchmark into a defensible internal target.
- Select your peer benchmark. Pick the industry and size band that actually matches your business, not the one that makes your current spend look reasonable.
- Align with strategy and risk tolerance. A company planning aggressive digital expansion needs a higher percentage than one focused on operational stability.
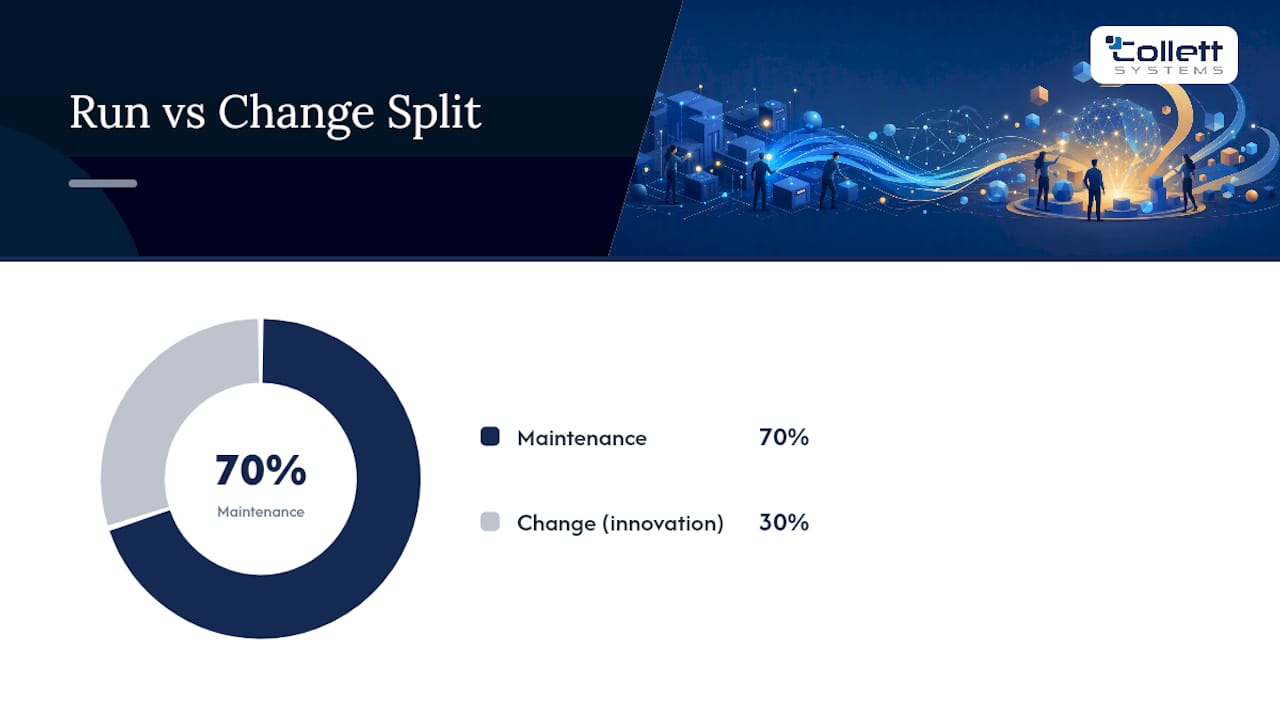
- Classify run versus change costs. Separate "keep the lights on" spending (maintenance, support, licensing renewals) from "grow the business" spending (new platforms, automation, AI pilots). This split matters more to a board than the raw percentage does.
- Review with finance and set KPIs. Translate the target into metrics finance can track quarter over quarter, not just an annual percentage.
Before finalizing a number, answer these:
- What's our regulatory exposure, and does it demand above-median security and compliance spend?
- How mature is our cloud migration, and are we still absorbing one-time transition costs?
- What are our innovation goals for the next 18 months, and does the current budget fund them?
Three red flags suggest your percentage needs adjustment. A ratio of maintenance to innovation spend above 80/20 usually means technical debt is quietly capping your growth. An IT percentage sitting well below your industry's 25th percentile alongside rising security incidents is a warning, not a savings win. And a percentage that's climbed three years running with no corresponding change in output or capability points to scope creep, not investment.
Pro Tip: Bring your run versus change split to the budget conversation before you bring the percentage. A CFO who sees 70% of IT spend going to maintenance will ask different questions than one who just sees a number that looks high compared to last year.
Where Does the Money Actually Go Inside an IT Budget?
Within that total, category shares are moving fast.
- Software and SaaS now account for an estimated 32% to 42% of total IT budgets, up from a much smaller share a decade ago, as VendorBenchmark's spending analysis documents.
- Cloud infrastructure spend continues climbing as workloads shift away from on-premises hardware.
- Cybersecurity has grown to an estimated 11% to 14% of IT budgets, reflecting both regulatory pressure and the rising cost of breaches.
- Professional services and outsourced support round out the remainder, often 10% to 15% depending on internal staffing depth.
The software share is the number to watch. With SaaS and software now claiming close to a third to nearly half of IT spend in many organizations, vendor consolidation and license audits have become one of the highest-leverage cost levers finance teams have. Gartner's 2026 forecast projects worldwide IT spending growing 9.8% in 2026 to exceed $6 trillion, and software is a major driver of that increase.
Should IT Spending Be Treated as OpEx or CapEx?
The accounting treatment you choose changes the percentage you report, even when actual cash spend stays identical. OpEx covers recurring costs like SaaS subscriptions, cloud hosting fees, and support contracts, expensed in the period incurred. CapEx covers purchases like servers or data center buildouts, capitalized and depreciated over several years.
- A large hardware purchase capitalized as CapEx shows up gradually through depreciation, smoothing your percentage over time.
- The same purchase treated as a cash outlay spikes your percentage in the year it happens.
- SaaS-heavy budgets skew almost entirely toward OpEx, which is part of why software companies show such high, but steady, IT percentages.
- Cash-basis figures tend to serve near-term budget and cash-flow decisions better, while accrual figures with depreciation serve multi-year benchmarking better.
For a deeper walkthrough of how to classify specific purchases, Collett Systems LLC's guide to CapEx versus OpEx for IT covers the decision tree in more detail.
What Is the AI Premium and How Do You Budget for It?

The AI premium refers to the additional spend organizations now need on top of traditional IT budgets to cover AI platform licensing, compute capacity, governance frameworks, and specialist hiring. BCG's research on AI investment argues that companies ignoring this explicit budget line are creating a strategic gap versus competitors who fund it deliberately.
Three practical ways to fund it without blowing up your total percentage:
- Rationalize existing SaaS spend first. Audits regularly uncover overlapping or underused licenses that can fund a meaningful chunk of new AI tooling.
- Reprioritize existing project budgets rather than requesting entirely new funding, especially for pilots.
- Phase AI rollouts so governance and permissions work, covered in Collett Systems LLC's piece on fixing permissions before an AI rollout, happens before platform costs scale up.
Pro Tip: Treat AI governance as a line item, not an afterthought bundled into "software." Boards want to see that oversight has a budget, not just the tools themselves.
What Metrics Should You Bring to the Board?
A percentage alone won't win a budget argument. Bring metrics that show context and trajectory.
- Your IT percentage of revenue versus the peer median for your industry and size band.
- IT spend per employee, which normalizes for headcount changes year over year.
- Percentage of IT budget allocated to innovation versus maintenance.
- Cloud spend as a percentage of total IT budget.
- Cybersecurity spend as a percentage of total IT budget.
- Concentration of software spend across your top three vendors, which flags renewal risk.
A workable narrative template: "We sit at the [percentile] for our peer group. That positioning [supports/lags] our strategic goal of [specific initiative], and the gap between where we are and the median costs us [specific operational or competitive impact]." Pairing the percentile position with a concrete business consequence, not just a number comparison, is what Deloitte's technology spending research suggests separates budget requests that get approved from ones that get tabled.
What Do Clients Usually Do Once They Know Their Number?
Once organizations settle on a target percentage, the conversation shifts from "how much" to "how predictable." Most want a fixed cost structure they can plan against rather than a variable one that swings with support tickets or emergency fixes. That preference shows up consistently: businesses gravitate toward standardized, security-first infrastructure over tiered add-on models, because a known monthly number per user is easier to defend to a board than a moving target. The percentage matters less than whether finance can trust it to hold.
Turn Your IT Percentage Into a Predictable Monthly Number
Knowing your target percentage is only half the job. The harder part is converting that number into infrastructure that actually holds steady month to month instead of drifting with surprise support tickets and emergency fixes. Some managed IT service providers build that predictability into a fixed per-user cost that covers a full stack, not a tiered menu where security and monitoring cost extra.
Such structures often include 24/7 monitoring, proactive support, and security management bundled into one price, so the percentage you present to your board this year is the percentage you continue to defend next year. Many organizations run on this model, with documented performance in security response and uptime backing it up. If you're ready to see where your current spend stands against a fixed, fully loaded alternative, start with the IT & Security Assessment and get a clear picture of what predictable IT actually costs for your business.
Sources
- How much should you spend on technology?, Deloitte
- Itbudgetcalculator
- APQC, Total IT budget, including depreciation/amortization, as a percentage of revenue
- Gartner forecast: worldwide IT spending growth, Gartner press release
FAQ
What Is Included in an IT Budget?
An IT budget typically includes hardware, software licenses and SaaS subscriptions, IT staff salaries, cloud infrastructure, cybersecurity tools and services, outsourced support, and depreciation on IT capital assets.
What Is the Average IT Spend per Employee?
Average IT spend per employee varies widely by industry, but it's best calculated by dividing your total IT budget (as defined by the formula above) by headcount, then comparing that figure against your specific industry and size band rather than a single global average.
What Is the 70-10-10-10 Budget Rule?
This isn't a standard, widely documented IT budgeting framework, so treat any specific percentages tied to it with caution. Most credible benchmarking bodies, including APQC and Deloitte, recommend allocating spend based on your own run versus change split and peer percentile position instead of a fixed formula.
What Is the 50/30/20 Rule for a Budget?
The 50/30/20 rule is a personal finance guideline for splitting income across needs, wants, and savings. It doesn't apply directly to enterprise IT budgeting, where the more relevant split is maintenance versus innovation spend, varying depending on modernization stage.