TL;DR:
- Recovery Time Objective (RTO) measures how quickly systems can be restored after an incident, while Recovery Point Objective (RPO) indicates acceptable data loss measured in time. Both metrics should be set based on a business impact analysis and validated through testing to ensure realistic recovery plans.
Recovery Time Objective (RTO) is the maximum acceptable time your systems can be down after an incident. Recovery Point Objective (RPO) is the maximum acceptable data loss, measured as time backward from the moment of failure to your last valid recovery point. Both metrics belong in every disaster recovery plan, and the fastest way to set them correctly is to run a Business Impact Analysis (BIA) or identify your Maximum Tolerable Downtime (MTD) for your highest-priority systems before you touch a single backup policy.
These two objectives are often confused, frequently misquoted in vendor conversations, and almost always set too loosely or too tightly. TechTarget's breakdown of RPO and RTO makes the distinction plain: RTO drives your infrastructure and orchestration decisions, while RPO drives your backup frequency and replication strategy. Get either one wrong and your recovery plan has a gap you won't discover until a real incident.
Table of Contents
- What do RTO and RPO actually measure?
- How should you tier applications by RTO and RPO?
- Which technical architectures actually meet tight RTO and RPO targets?
- Why does tighter RTO/RPO cost so much more, and when is "zero" the wrong target?
- How do you test and validate that your RTO and RPO are actually achievable?
- How do cloud platforms and ransomware change your RTO and RPO planning?
- Key Takeaways
- The gap between documented targets and real recovery
- Collett Systems LLC helps you set and meet real recovery targets
- Authoritative sources and further reading
What do RTO and RPO actually measure?
The directional difference is the thing most teams get backwards. RTO measures forward from the moment of an incident: how long until systems are back in service? RPO measures backward from the same moment: how far back in time does your last clean recovery point sit?
Picture it this way:
[Last backup] ←,, RPO window,, → [Incident] ←,, RTO window,, → [Systems restored]
RPO answers "how much data can we afford to lose?" RTO answers "how long can the business operate without this system?" They are related but they are not the same question, and they are not owned by the same team.
Units matter. An RTO measured in seconds implies hot standby or active-active architecture. An RTO in hours implies warm standby or scripted failover. An RTO in days means cold restore from backup, which is acceptable for archival systems and catastrophic for a payment processor. The same scale applies to RPO: a 15-minute RPO requires near-continuous replication; a 24-hour RPO can be satisfied by a nightly backup job.
Ownership is split. Infrastructure and orchestration teams typically own RTO, because they control failover automation, compute provisioning, and cutover procedures. Backup and storage teams typically own RPO, because they control snapshot frequency, replication lag, and retention policy. Both metrics require sign-off from business stakeholders, not just IT, because the acceptable thresholds are ultimately a business risk decision, not a technical one. NIST SP 800-34 formalizes this by tying RTO directly to contingency planning and MTD, requiring that IT recovery objectives align with organizational risk tolerances.
How should you tier applications by RTO and RPO?
Not every system deserves the same investment. Tiering lets you concentrate budget and complexity where business impact is highest and accept longer recovery windows where it is not.
| Tier | Example systems | Target RTO | Target RPO | Typical technology pattern |
|---|---|---|---|---|
| Tier 0 | Payment processing, ERP core, production control | < 15 minutes | < 5 minutes | Active-active, synchronous replication |
| Tier 1 | CRM, order management, core databases | 1, 4 hours | 15, 60 minutes | Hot standby, asynchronous replication |
| Tier 2 | Internal portals, email, file shares | 4, 24 hours | 1, 4 hours | Warm standby, frequent incremental backups |
| Tier 3 | Reporting, archives, dev/test environments | 24, 72 hours | 24 hours | Cold restore from scheduled backups |
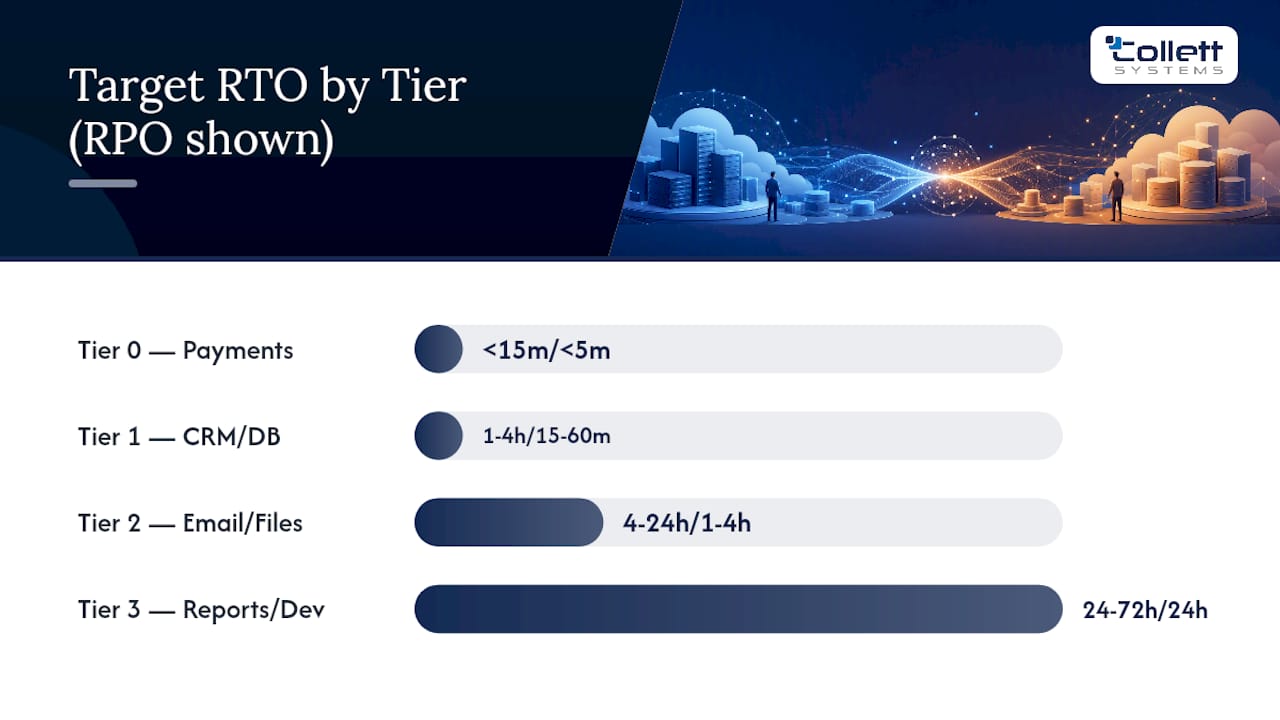
A few mapping rules that hold across most industries: transactional systems that touch revenue or compliance belong in Tier 0 or Tier 1. Batch and reporting systems almost always belong in Tier 2 or Tier 3, because a 24-hour-old report rarely causes irreversible harm. Manufacturing production control systems are a notable exception, a line stoppage can cost more per hour than many financial systems, which is why manufacturers in particular often need Tier 0 targets for systems most IT teams would classify as operational middleware.
Dependency mapping is where tiering breaks down in practice. An application-level RTO is the aggregate of every component's RTO plus sequencing and verification time. If your CRM depends on an authentication service classified as Tier 2, your CRM's effective RTO cannot be better than Tier 2 regardless of what you wrote in the plan.
Which technical architectures actually meet tight RTO and RPO targets?
Choose the architecture that matches your target band, cost envelope, and operational capacity. There is no universal answer, but the mapping is predictable.
- Hot standby / active-active: Both sites serve live traffic. RTO approaches zero; RPO approaches zero for in-flight transactions. Distributed active-active architectures can approach near-zero targets for specific workloads, but they require careful conflict resolution and significantly higher operational overhead.
A critical architectural caution: synchronous replication propagates corruption and ransomware encryption in real time. A replicated environment is not a safe recovery point if the threat has already touched the source. You need immutable, isolated backups alongside replication, not instead of it. Application-consistent snapshots (taken with the application quiesced) are also meaningfully safer than crash-consistent snapshots for databases, because they eliminate the need to replay transaction logs from an unknown state.
Pro Tip: When your RPO target is under 15 minutes, prefer asynchronous replication over more frequent snapshots. Snapshot overhead accumulates under load and can itself cause performance degradation that masks the incident you are trying to recover from.
Physical infrastructure dependencies also affect achievable RTO. Power continuity, fuel supply for generators, and data center uptime planning all set a floor on how fast systems can come back. Data center uptime planning covers fuel dependency and physical resilience factors that IT-only DR plans routinely overlook.

Why does tighter RTO/RPO cost so much more, and when is "zero" the wrong target?
Lower (tighter) RTO and RPO increase cost and complexity nonlinearly. Moving from a 4-hour RTO to a 1-hour RTO might double infrastructure spend. Moving from 1 hour to near-zero can multiply it by five or more, because you are no longer just adding capacity, you are adding synchronous replication, active-active architecture, cross-region standby capacity, automated failover orchestration, and the operational staff to maintain and test all of it.
The cost drivers stack quickly:
- Synchronous replication requires low-latency dedicated links between sites.
- Active-active architecture doubles compute and storage at minimum.
- Cross-region cloud capacity carries ongoing reservation costs even when idle.
- Verification and validation steps add time and skilled labor to every recovery exercise.
- Staff overhead for testing, runbook maintenance, and incident response grows with complexity.
AWS's Well-Architected reliability guidance is direct on this point: striving for zero RPO or RTO is frequently an anti-pattern unless a workload is genuinely mission-critical. The risks are not just financial. Highly complex recovery architectures introduce hidden dependency risks, create false confidence, and often fail in ways that simpler architectures do not. A system with five layers of automated failover can fail silently at layer three while the monitoring dashboard shows green.
The practical guidance: invest in near-zero targets only where the BIA shows that the cost of downtime or data loss exceeds the cost of the architecture required to prevent it. For most SMB workloads, a well-tested 1-hour RTO and 15-minute RPO is more reliable in practice than an untested near-zero target built on complexity no one fully understands.
How do you test and validate that your RTO and RPO are actually achievable?
Testing is non-negotiable. A stated RTO is a hypothesis until a measured exercise proves it. Many organizations discover during their first real restore test that their actual recovery time is two to three times their documented target.
DR test checklist:
- Define scope and success criteria before the test begins. Which systems, which failure scenario, and what constitutes a successful recovery? Write it down.
- Dry-run failover. Execute the failover procedure in a non-production environment. Record every step and timestamp.
- Full restore test. Restore from backup to a clean environment. Do not restore over the production system.
- Data integrity checks. Verify that recovered data matches the expected state. Check transaction logs, record counts, and application-level consistency.
- Post-test retrospective. Compare actual times against targets. Document gaps, assign owners, and set a remediation deadline.
Metrics to record during every test:
- Detection time (incident to alert)
- Decision time (alert to recovery initiation)
- Restore time (initiation to data available)
- Validation time (data available to confirmed clean)
- Cutover time (confirmed clean to users back in service)
- Actual data gap (age of recovered data vs. incident time)
Your Actual Recovery Time (RTA) is the sum of all five stages. If RTA exceeds your RTO, you have a documented gap that requires either a faster architecture or a revised target. The NIST Cybersecurity Framework provides governance-level structure for integrating these test results into your broader risk management program, which matters when you need to demonstrate recovery readiness to auditors or regulators.
Cadence guidance: validate critical Tier 0 and Tier 1 systems at least quarterly. Tier 2 systems warrant semiannual testing. Tier 3 can be tested annually. Any major infrastructure change, cloud migration, or significant application update should trigger an out-of-cycle test regardless of the calendar.
How do cloud platforms and ransomware change your RTO and RPO planning?
Cloud platforms change the economics of tight recovery objectives. Provisioning a warm standby in AWS or Azure no longer requires owning a second data center, you pay for capacity when you need it. AWS Resilience Hub can assess individual application components against your defined RTO/RPO policies and generate remediation recommendations with cost estimates, which shortens the gap between "we set a target" and "we know what it costs to meet it."
But cloud introduces its own dependencies. Network throughput between regions, provider SLA windows, cross-region data transfer costs, and API rate limits all affect achievable RTO in ways that on-premises architectures do not. A cloud-native DR plan that assumes instant cross-region failover will fail if the network path is saturated or the provider's control plane is degraded.
Ransomware deserves its own paragraph because it fundamentally changes the RTO calculation. A standard hardware failure has a known scope. Ransomware does not. Before you can restore, you need to know what was encrypted, when the encryption started, whether the threat actor still has access, and whether your recovery points are clean. CISA's incident response playbooks document the investigation and validation steps that federal agencies follow before returning systems to service, and those steps take time. SentinelOne's research notes that ransomware incidents commonly push realistic RTOs into 24, 72 hour ranges due to forensic investigation and the need to restore from verified clean recovery points.
The practical implication: your RTO calculation for any system at risk of ransomware should include forensic and clean-room time as explicit stages, not as an afterthought. Immutable, air-gapped, or isolated backup copies are not optional for those systems. For more on why ransomware recovery is a process rather than a product, see Collett Systems' breakdown of ransomware recovery.
Key Takeaways
RTO and RPO are distinct, directional metrics that must both be derived from business impact analysis and validated through measured testing, not assumed from vendor defaults.
| Point | Details |
|---|---|
| RTO measures forward, RPO backward | RTO = time from incident to recovery; RPO = time from incident back to last clean data point. |
| Start with MTD, not vendor SLAs | Set Maximum Tolerable Downtime first; RTO must always be less than MTD with a safety buffer. |
| Tighter targets cost more, nonlinearly | Moving from a 4-hour RTO to near-zero can multiply infrastructure spend by five or more. |
| Test to get your Actual Recovery Time | RTA = detection + decision + restore + validation + cutover; untested targets are just guesses. |
| Collett Systems LLC operationalizes targets | Collett Systems provides managed BDR with tested restores, documented runbooks, and verified RTO/RPO metrics for SMBs in Southeastern Wisconsin. |
The gap between documented targets and real recovery
Most organizations set RTO and RPO targets once, file them in a DR plan, and never test them against a realistic failure scenario. The targets look reasonable on paper. Then a real incident happens, and the actual recovery time is three times the documented RTO because no one accounted for detection lag, decision-making delay, or the time it takes to validate data integrity after a restore.
The metric that matters is not your documented RTO. It is your Actual Recovery Time under realistic conditions, including the chaos, the incomplete runbooks, and the dependency that nobody mapped. The only way to know that number is to test, measure, and close the gap between what you planned and what actually happens.
There is also a tendency to treat tighter targets as inherently better. They are not. A near-zero RTO built on synchronous replication across three regions sounds impressive until ransomware encrypts the source and the replication faithfully propagates the encryption to every standby. The right target is the one that matches your business impact, fits your budget, and can be demonstrated in a real test. For most SMBs, that means a tiered model with well-tested procedures, not the most aggressive architecture money can buy.
Collett Systems LLC helps you set and meet real recovery targets
For small and mid-sized businesses in Southeastern Wisconsin, the gap between a documented RTO and a proven one is exactly where Collett Systems LLC works. Our managed backup and disaster recovery services include BIA-led target setting, tier classification, tested restores, and documented runbooks so your recovery objectives are numbers you can stand behind, not numbers you hope are right.
We run verified restore tests, track Actual Recovery Time against your stated targets, and update runbooks when your environment changes. For manufacturers and financial firms where downtime costs are highest, we build the architecture to match the business impact, not the other way around. Our managed IT services include fixed per-user pricing, so there are no surprises when it is time to invest in tighter recovery objectives.
Ready to know where your recovery targets actually stand? Start with our IT & Security Assessment to get a clear picture of your current backup posture, dependency gaps, and the realistic RTO/RPO your environment can support today.
Authoritative sources and further reading
These resources are worth bookmarking for standards compliance, cloud guidance, and forensic planning.
- What is the difference between RPO and RTO from a backup perspective
- RTO vs RPO: Key Differences in Disaster Recovery Planning
- Planning for recovery objectives, AWS Well-Architected reliability pillar
- NIST SP 800-34 Rev. 1 (Contingency Planning Guide for Federal Information Systems)
- RPO vs RTO Calculator Guide for DR Planning
- RTO vs RPO, Cockroach Labs