Every monthly MSP report needs three KPI categories on page one: profitability, productivity, and client satisfaction. The highest-priority metrics inside those categories are MRR, ARPU, and gross margin for profitability; technician utilization and effective hourly rate for productivity; and CSAT, NPS, and churn for client health, backed by MTTR, SLA adherence, and patch compliance for operational proof. Skip vanity counts like raw ticket volume unless you pair them with resolution quality.
TL;DR:
- Profitability metrics like monthly recurring revenue and gross margin should stay within the 50-70% range to ensure healthy margins.
- Technician productivity is best measured by effective hourly rate and touches per ticket, with utilization kept below 85% to prevent burnout.
- Client satisfaction scores should be tracked separately as CSAT provides transactional insight while NPS predicts long-term relationship strength.
- Operational metrics such as mean time to resolution and SLA adherence must be paired with ticket volume to accurately assess service quality.
- Security reports need to focus on patch compliance by severity and vulnerability remediation times to accurately depict ongoing risk levels.
Table of Contents
- What MSP Reporting Metrics Actually Measure
- Profitability KPIs to Track Every Month
- How Do You Measure Technician Productivity?
- Which Client Metrics Predict Long-Term Value?
- What Operational Metrics Prove Service Quality?
- What Security Metrics Belong in a Client Report?
- Building a Monthly MSP Report and Dashboard
- From KPIs to Decisions: Strategic Recommendations
- Getting CSAT and NPS Right in Practice
- An Operator's View on Outcome-Focused Reporting
- Turn These Metrics Into a Working Report
- Sources
- FAQ
What MSP Reporting Metrics Actually Measure
MSP reporting metrics translate technical activity into business outcomes clients and owners can act on. A report that lists tickets closed and servers patched tells you you activity happened, not whether the business got healthier. Rev.io's KPI research points to profitability, productivity, and client satisfaction as the three categories that top-performing MSPs track to guide growth decisions, and that framing holds up because each category answers a different question: are we making money, are we running efficiently, and will clients stay?
The distinction matters because activity metrics and outcome metrics often move in opposite directions. Ticket volume can climb while client trust falls, especially when the same three issues keep reopening. Research on MSP accountability argues that reporting has to pair volume with resolution quality, or the dashboard becomes noise. That's the standard your monthly report should meet: every number earns its place by connecting to a decision, a price, or a client relationship.
Profitability KPIs to Track Every Month
Profitability KPIs reveal whether your pricing model actually works once labor and overhead hit the books. Monthly Recurring Revenue (MRR) is total recurring contract value billed monthly. Average Revenue Per User (ARPU) is MRR divided by billed users or endpoints. Gross margin is (revenue minus cost of service delivery) divided by revenue, and most healthy MSPs run gross margins in the 50-70% range.
Beyond the basics, portfolio-level metrics show which clients quietly erode margin:
- Shadow billable hours: unbilled technician time spent on a fixed-fee client, which reveals scope creep.
- W2 multiple: revenue generated per technician divided by their fully loaded cost; a healthy target is often three times or higher.
- Contribution per hour: gross profit generated per technician hour worked.
Statistic Callout: A technician generating a W2 multiple below a certain threshold is likely costing you money on every ticket they touch, even if their calendar looks full. MSPCFO's portfolio reporting framework treats this as one of five essential financial metrics for spotting margin leaks before renewal season.
How Do You Measure Technician Productivity?
Technician utilization is billable or productive hours divided by total available hours, and it's the single number that tells you whether your team's calendar matches your revenue model. Effective hourly rate takes it further: total labor revenue for a technician divided by hours actually worked, which shows what you're really earning per hour after discounts, scope creep, and rework.
NetSuite's benchmark data cautions against chasing utilization above 85%, since technicians pushed that hard tend to burn out and skip documentation, which shows up later as repeat tickets.
Watch these companion metrics to catch process problems utilization alone won't reveal:
- Touches per ticket: how many times a ticket changes hands before resolution; anything above two or three signals routing or knowledge-base gaps.
- Non-billable time: hours spent on internal tools, training, or admin work that don't hit a client invoice.
- Reactive hours per endpoint: a rising trend here usually means your proactive monitoring isn't catching problems early enough.
Pro Tip: If touches per ticket keeps climbing, don't add headcount first. Fix your knowledge base and ticket routing rules. That's usually a cheaper and faster win than hiring.
Which Client Metrics Predict Long-Term Value?
Client satisfaction score (CSAT) measures a single interaction: ask "how satisfied were you with this ticket?" right after resolution, on a 1-5 scale. Net Promoter Score (NPS) measures the relationship: "how likely are you to recommend us?" on a 0-10 scale, then subtract the percentage of detractors (0-6) from promoters (9-10). Ten core MSP KPIs research recommends running both, since CSAT catches service breakdowns fast while NPS tracks whether the relationship is strengthening or eroding over quarters.
Churn rate is lost clients divided by total clients over a period, usually calculated monthly and rolled into an annual figure. Renewal rate is its inverse: contracts renewed divided by contracts up for renewal.
- Customer Lifetime Value (CLTV) estimates total revenue a client generates before churning, typically ARPU multiplied by average client lifespan in months.
- Watch the CAC to CLTV ratio; a client that costs more to acquire than they're worth over three years is a structural problem, not a sales win.
- Flag any account where CSAT drops two points in a row or effective hourly rate falls below your break-even threshold for portfolio review.
What Operational Metrics Prove Service Quality?
Mean Time to Resolution (MTTR) is total resolution time across closed tickets divided by ticket count, usually reported in hours. First-response time measures how fast a technician acknowledges a new ticket, separate from resolution. First-contact resolution (FCR) rate is tickets closed on first contact divided by total tickets, and it's often the metric clients feel most directly.
- Calculate SLA adherence as tickets resolved within contracted time divided by total tickets, then break out adherence by priority tier so a P1 breach doesn't get buried in average performance.
- Pair ticket volume with FCR and MTTR on the same chart. Rising volume with stable or improving MTTR shows real capacity gains; rising volume with rising MTTR shows a team drowning.
- Report uptime per critical system, not a single blended number. A client's line-of-business application hitting 98% uptime matters more than a printer server hitting 99.9%.
- Track repeat-incident rate, meaning the same issue reopening within 30 days, since it exposes root-cause failures that a clean resolution-time number will hide.
What Security Metrics Belong in a Client Report?
Patch compliance rate, broken out by severity, shows whether critical vulnerabilities are closing fast or lingering. Report it on a rolling window, typically the past 30 days, since a single snapshot can hide slow-moving risk.
- Patch compliance by severity: critical and high-severity patches should show a separate line from routine updates, since executives care about exposure, not patch counts.
- Incident summary: number of security incidents, average time-to-contain, and which systems or users were affected.
- Vulnerability remediation time: days between detection and closure, tracked separately from patch compliance since not every vulnerability has a patch available.
Statistic Callout: A patch compliance rate that looks strong in aggregate can still leave a client exposed if critical-severity patches lag behind low-priority ones. LogMeIn's operational KPI research recommends reporting SLA adherence and security metrics with the same trend context you'd apply to financial numbers, not as one-off snapshots.
Research on business-outcome reporting makes the same point: technical controls only register with leadership once they're framed as reduced risk or protected uptime.
Building a Monthly MSP Report and Dashboard
Pulling a defensible report starts with clean data, not a slide template. You need PSA time entries and invoices for financial KPIs, RMM device counts for per-endpoint normalization, your ticketing system for operational metrics, and CSAT/NPS survey results for client health.
- Sync PSA time entries and invoices so labor cost maps directly to billed revenue per client.
- Normalize per seat or per endpoint rather than reporting raw totals, so a 200-user client and a 20-user client compare fairly.
- Apply trailing three-month smoothing to volatile metrics like utilization and ticket volume, since financial reporting practices show single-month snapshots swing wildly with seasonal ticket spikes or a single large project.
- Build the dashboard in this order: one-page executive summary, client health scores, financial grade, operational trends, security snapshot.
Report operational metrics monthly. Save deeper financial and strategic review, including QBR-level KPI trends, for a quarterly cadence, where three months of smoothed data gives you something worth deciding on.
From KPIs to Decisions: Strategic Recommendations
A KPI only earns its spot on a report if it drives a decision.
Use QBR meetings to ask pointed questions your KPIs already answered: Did effective hourly rate on this account fall below break-even? Did patch compliance lag on critical severity items two months running? Those answers should drive pricing conversations, remediation plans, or infrastructure investment, not just a status update.
- Prioritize automation and runbooks first, since fixing a broken patch workflow scales across every client at once.
- Fix pricing and contract terms second, targeting accounts where effective hourly rate or shadow billable hours show margin erosion.
- Address staffing last, once process and pricing fixes have removed the noise from your utilization numbers.
Pro Tip: Build a 30/60/90-day follow-up checklist for every KPI-driven goal. Thirty days for a diagnostic recheck, sixty for a trend confirmation, ninety for a QBR-ready result. TSIA's research on outcome-based managed services argues that AI-assisted, real-time KPI visibility is what makes this cadence sustainable instead of a quarterly scramble.
Getting CSAT and NPS Right in Practice
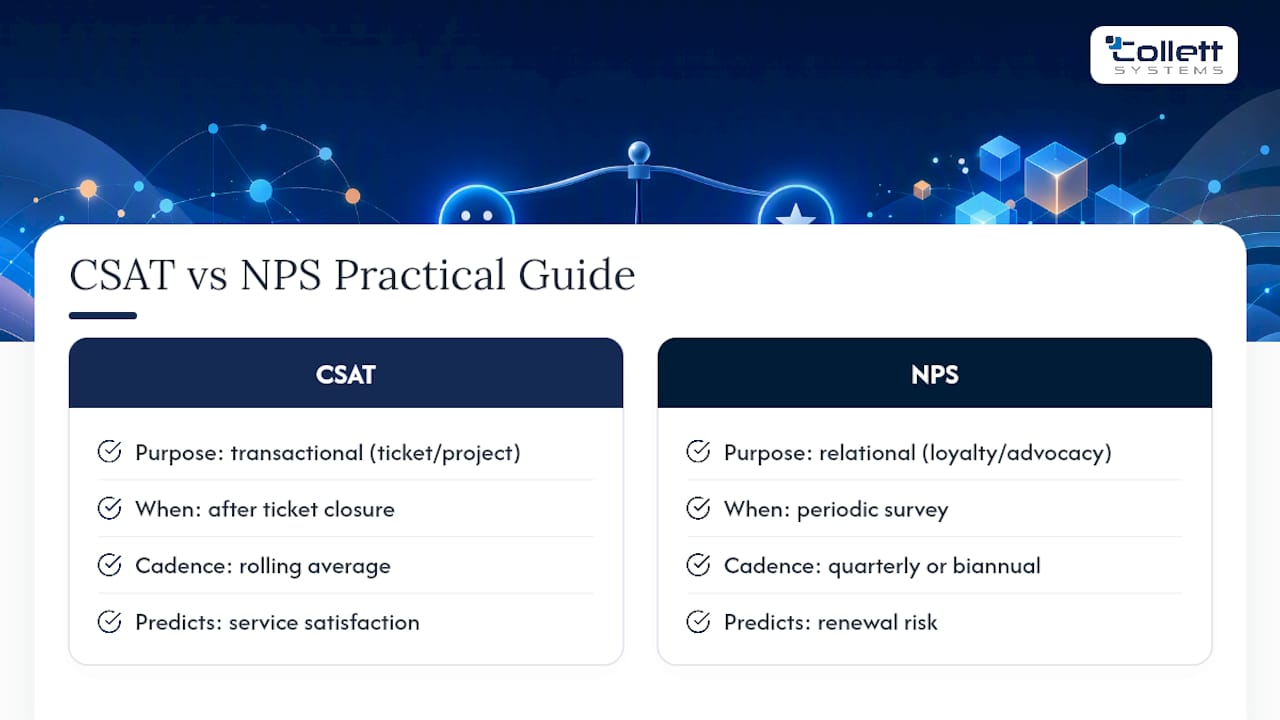
CSAT and NPS answer different questions, and reporting them as interchangeable numbers is one of the more common mistakes we see in monthly reports. CSAT is transactional: it tells you whether a specific ticket, onboarding, or project met expectations. Send the survey immediately after ticket closure, while the interaction is fresh, and track it as a rolling average rather than a single score.
NPS is relational. It asks whether the client would stand behind you publicly, which makes it a better predictor of renewal than any single ticket score. Run NPS quarterly or twice a year rather than after every interaction, since asking too often produces survey fatigue and flat, meaningless responses.
The two metrics tell you different things when they diverge. A client with strong CSAT scores but a falling NPS is often satisfied with day-to-day support while losing confidence in the relationship, maybe over pricing, communication, or a slow response to a strategic ask. That combination should trigger an account review before the contract comes up for renewal, not after.
Segment both scores by client size and industry. A 20-person accounting firm and a 150-person manufacturer have different expectations for response time and communication style, and blending their scores into one company-wide average hides which segment actually needs attention. LogMeIn's KPI framework recommends tracking CSAT and NPS alongside churn and CLTV specifically because satisfaction scores alone don't predict revenue risk. A client can report high CSAT every month and still churn over a single unresolved security incident or a competitor's lower quote.
An Operator's View on Outcome-Focused Reporting
Reporting tied to outcomes, not activity counts, is what defends your pricing at renewal. When a report shows falling reactive hours per endpoint alongside stable margin, a rate increase becomes a conversation about value, not a negotiation.
We've seen MSPs cut churn simply by catching a declining NPS trend before the renewal call, addressing the underlying communication gap directly instead of discovering it in an exit interview. Build your dashboard around the categories in this article, then commit to reading the trend, not the snapshot, every month.
, Dustin Collett
Turn These Metrics Into a Working Report
Knowing which KPIs belong on your report is one thing. Building the systems that pull clean PSA, RMM, and ticketing data every month without a technician manually stitching spreadsheets together is another. An MSP built its model around exactly that gap: a fixed per-user managed IT stack with 24/7 monitoring and proactive support, so the operational and security data behind these metrics gets captured consistently instead of reconstructed at month's end.
If your current reports feel more like activity logs than decision tools, start with an IT & Security Assessment to see where your data gaps actually are. Businesses that want the full standardized stack, fixed pricing, defined SLAs, and no tiered upsells, can review Managed IT Services directly. Organizations with an internal IT team looking to add monitoring and reporting depth without replacing staff should look at Co-Managed IT Services. Book the assessment and find out what your next monthly report should actually contain.
Sources
For formula-level detail, review MSPCFO's portfolio reporting metrics and LogMeIn's KPI list. For goal-setting frameworks that pair with these KPIs, see this guide to setting business goals. For asset data feeding your metrics, read our 90-day IT asset inventory roadmap.
- Five Essential Financial Metrics for MSP Portfolio Reporting, MSPCFO
FAQ
What Are Five Examples of MSP Reporting Metrics?
Five commonly tracked examples are Monthly Recurring Revenue (MRR), technician utilization, Customer Satisfaction Score (CSAT), Mean Time to Resolution (MTTR), and SLA adherence. Each one maps to a core category: financial health, workforce efficiency, client experience, or service delivery quality.
What Are the Five Main KPIs for an MSP?
Most MSP operators prioritize MRR, gross margin, technician utilization, CSAT or NPS, and churn rate as their five core KPIs. Rev.io's KPI research groups these under profitability, productivity, and client satisfaction, the three categories that belong on any monthly report's front page.
What Does MSP Stand For?
MSP stands for managed service provider, a company that remotely manages a client's IT infrastructure, security, and support under a recurring contract. This firm operates as an MSP for small and mid-sized businesses, using fixed per-user pricing instead of tiered service bundles.
Can You Give an Example of How an MSP Uses These Metrics?
An MSP might notice reactive hours per endpoint climbing for one client, then trace it to outdated patch policies causing repeat incidents. Fixing the patch schedule and rerunning the metric 90 days later confirms whether the fix worked, which is the outcome-focused reporting loop this article describes throughout.
How Much Does an IT & Security Assessment From Collett Systems LLC Cost?
Pricing for the IT & Security Assessment is not published online. Contact Collett Systems LLC directly to get current pricing based on your organization's size and environment.